
 Ohio — Open to Work
2026
Reseller Dashboard
Spreadsheet to dashboard, with dual currency support
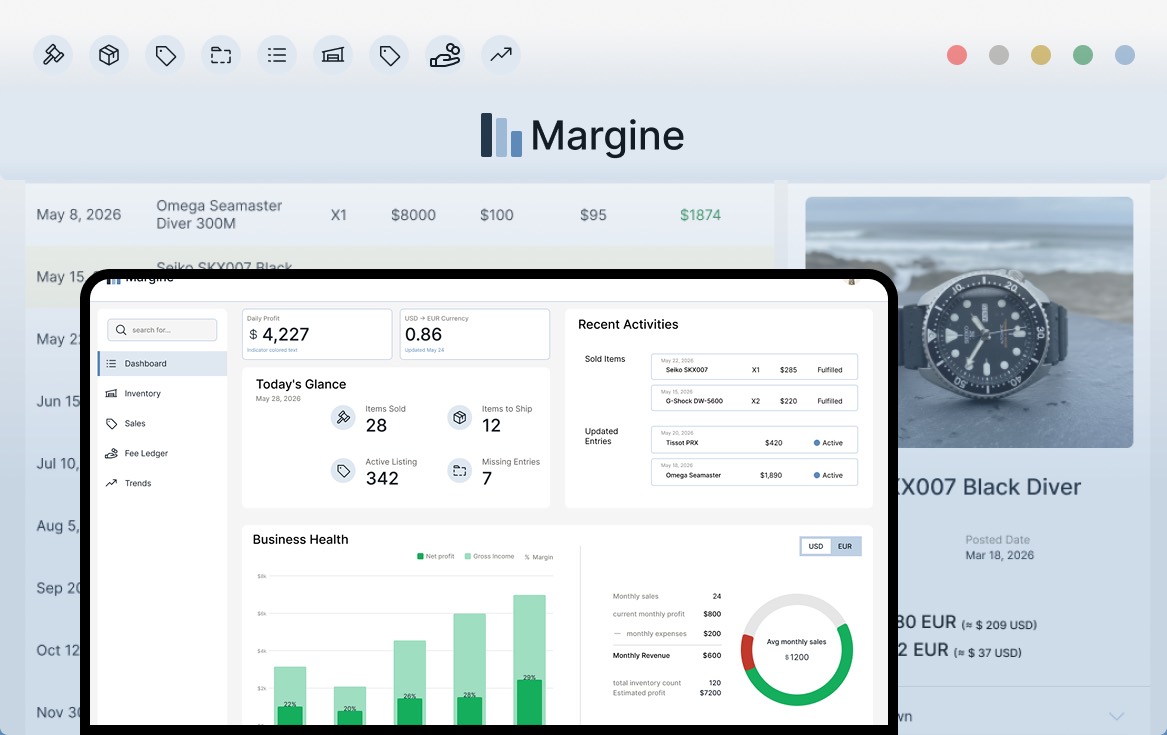
01. Overview
Four questions answered when they open the platform
A personal challenge to design a real dashboard, in a domain where dual currency is common and spreadsheets handle it badly. Research, information architecture, and prototyping. Built in Figma and Figma Make, rendered with Cursor and Claude Code.
Profit
Am I making profit this month?
Expenses
Where’s my expenses going?
Inventory
What’s my current inventory?
Timing
What’s selling, and when?
AI Involvement
Used to speed exploration, not replace decisions. Color, typography, and wireframes were set independently first; a generated design foundation script was filtered and rebuilt by hand before becoming the working prototype
02. Showcase
The four questions from Overview, answered in practice. Three moments from the dashboard show how:
Moment 01 — The Dashboard
Status before anything else
A reseller needs to know where the business stands before checking inventory or sales. Profit and currency lead at the top, today’s glance below, recent activity alongside, and business health showing margin month by month
Moment 02 — Inventory & Sales
One click, full context
Marking an item active, moves it from inventory to sales automatically. Once clicked open, every cost, currency, and reference shows up in a side panel, no jumping between pages to do the math
Moment 03 — Trends
Numbers up top, charts underneath
Analytical figures stay up top for number-sensitive reading, graphs support them below, and inventory ranks by ROI so resellers can estimate what to source next
Try the prototype
Live prototype in HTML, with currency switching and linked detail panel
03. The Problem
The data outgrows the spreadsheet
There’s no accountant double-checking the math. The reseller enters every figure, then reads it back themselves, and each sale runs through the same manual pass:
01
Log the sale
02
Convert the currency by hand
03
Subtract platform fees
04
Update the inventory row
05
Recalculate profit
06
Scroll back to compare
Resellers have used spreadsheets for years and the familiarity is worth keeping, so the goal isn’t to replace it. But when the numbers get dense, a tighter system can boil them down: this dashboard keeps the spreadsheet’s logic, only changes how it’s read.
04. The Research
To ground the project, the starting point was a real reseller spreadsheet sold online, followed by an audit of Flipwise (the closest existing product). The persona is assumptions-based, built from observed reselling behavior and public patterns rather than interviews
01
The spreadsheet’s data model is solid, but its presentation is the problem. Everything is structured but flat, compacted into a single view, so reading it takes more work as inputs pile up
02
Flipwise is built around eBay’s API: single-platform, fully automated, and single currency. Useful as a framework reference, not as a model
03
Costs and currencies are cross-referenced mentally, by toggling between views. Profit is known by the month, rarely by the item
05. Design Decisions
Four decisions shaped the dashboard. Each had a simpler alternative on the table, and each was rejected for a specific reason.
Currency selector and toggles are shown at the top of the sections
Currency toggles sit wherever the decisions happens, not behind one global setting. That makes it fast to compare figures or check what was actually spent in a give currency
Convert every figure into both currencies
Profit and currency lead the layout
Status (profit, currency, business health) and action (today’s glance) sit in clearly separate sections, so it’s obvious what to check versus what to do
One flat view in the spreadsheet’s own order
Inventory and sales linked, with a detail side panel
Keeps currency math in view while pricing, instead of cross-referencing two open pages by memory
Separate pages, cross-referenced by hand
Numbers kept, then condensed and sorted
The spreadsheet isn’t being replaced, just organized so number-sensitive and visual readers both get what they need
Replace the rows with charts entirely
06. Reflections
01 Validation
Test the four core questions with real resellers
The persona is assumptions-based, built from observed reselling behavior and public patterns rather than interviews. Those four questions drove the entire layout. Everything downstream rests on a premise nobody has confirmed yet
02 Constraint
Multi-currency was the hardest boundary to hold
Deciding where conversion belongs, and where it doesn’t, shaped the overview, the ledger and the item panel. Getting that boundary wrong in either direction would have made the dashboard harder to read than the spreadsheet it replaces
03 Craft
A generated foundation still needs editing time
Filtering and rebuilding what AI produced took longer than scoping a smaller set from the start would have